SL Paper 1
A liquid is heated so that after \(20\) seconds of heating its temperature, \(T\) , is \({25^ \circ }{\text{C}}\) and after \(50\) seconds of heating its temperature is \({37^ \circ }{\text{C}}\) .
The temperature of the liquid at time \(t\) can be modelled by \(T = at + b\) , where \(t\) is the time in seconds after the start of heating.
Using this model one equation that can be formed is \(20a + b = 25\) .
Using the model, write down a second equation in \(a\) and \(b\) .
Using your graphic display calculator or otherwise, find the value of \(a\) and of \(b\) .
Use the model to predict the temperature of the liquid \(60{\text{ seconds}}\) after the start of heating.
A plumber in Australia charges 90 AUD per hour for work, plus a fixed cost. His total charge is represented by the cost function C = 60 + 90t, where t is in hours.
Write down the fixed cost.
It takes \(3 \frac{1}{2}\) hours to complete a job for Paula. Find the total cost.
Steve received a bill for 510 AUD. Calculate the time it took the plumber to complete the job.
The straight line, L, has equation \(2y - 27x - 9 = 0\).
Find the gradient of L.
Sarah wishes to draw the tangent to \(f (x) = x^4\) parallel to L.
Write down \(f ′(x)\).
Find the x coordinate of the point at which the tangent must be drawn.
Write down the value of \(f (x)\) at this point.
Consider the two functions, \(f\) and \(g\), where
\(f(x) = \frac{5}{{{x^2} + 1}}\)
\(g(x) = {(x - 2)^2}\)
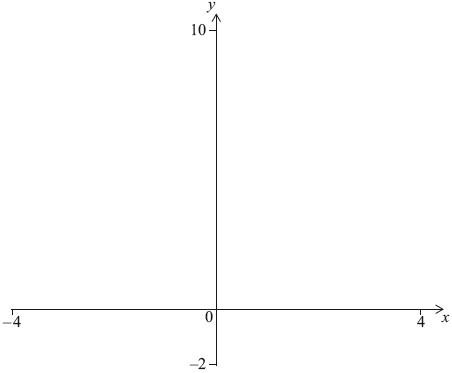
Sketch the graphs of \(y = f(x)\) and \(y = g(x)\) on the axes below. Indicate clearly the points where each graph intersects the y-axis.
Use your graphic display calculator to solve \(f(x) = g(x)\).
A quadratic function \(f\) is given by \(f(x) = a{x^2} + bx + c\). The points \((0,{\text{ }}5)\) and \(( - 4,{\text{ }}5)\) lie on the graph of \(y = f(x)\).
The \(y\)-coordinate of the minimum of the graph is 3.
Find the equation of the axis of symmetry of the graph of \(y = f(x)\).
Write down the value of \(c\).
Find the value of \(a\) and of \(b\).
Maria owns a cheese factory. The amount of cheese, in kilograms, Maria sells in one week, \(Q\), is given by
\(Q = 882 - 45p\),
where \(p\) is the price of a kilogram of cheese in euros (EUR).
Maria earns \((p - 6.80){\text{ EUR}}\) for each kilogram of cheese sold.
To calculate her weekly profit \(W\), in EUR, Maria multiplies the amount of cheese she sells by the amount she earns per kilogram.
Write down how many kilograms of cheese Maria sells in one week if the price of a kilogram of cheese is 8 EUR.
Find how much Maria earns in one week, from selling cheese, if the price of a kilogram of cheese is 8 EUR.
Write down an expression for \(W\) in terms of \(p\).
Find the price, \(p\), that will give Maria the highest weekly profit.
In a trial for a new drug, scientists found that the amount of the drug in the bloodstream decreased over time, according to the model
\[D(t) = 1.2 \times {(0.87)^t},{\text{ }}t \geqslant 0\]
where \(D\) is the amount of the drug in the bloodstream in mg per litre \({\text{(mg}}\,{{\text{l}}^{ - 1}}{\text{)}}\) and \(t\) is the time in hours.
Write down the amount of the drug in the bloodstream at \(t = 0\).
Calculate the amount of the drug in the bloodstream after 3 hours.
Use your graphic display calculator to determine the time it takes for the amount of the drug in the bloodstream to decrease to \(0.333{\text{ mg}}{{\text{1}}^{ - 1}}\).
The number of bacteria in a colony is modelled by the function
\(N(t) = 800 \times 3^{0.5t}, {\text{ }} t \geqslant 0\),
where \(N\) is the number of bacteria and \(t\) is the time in hours.
Write down the number of bacteria in the colony at time \(t = 0\).
Calculate the number of bacteria present at 2 hours and 30 minutes. Give your answer correct to the nearest hundred bacteria.
Calculate the time, in hours, for the number of bacteria to reach 5500.
A company sells fruit juices in cylindrical cans, each of which has a volume of \(340\,{\text{c}}{{\text{m}}^3}\). The surface area of a can is \(A\,{\text{c}}{{\text{m}}^2}\) and is given by the formula
\(A = 2\pi {r^2} + \frac{{680}}{r}\) ,
where \(r\) is the radius of the can, in \({\text{cm}}\).
To reduce the cost of a can, its surface area must be minimized.
Find \(\frac{{{\text{d}}A}}{{{\text{d}}r}}\)
Calculate the value of \(r\) that minimizes the surface area of a can.
Given the function \(f (x) = 2 \times 3^x\) for −2 \( \leqslant \) x \( \leqslant \) 5,
find the range of \(f\).
find the value of \(x\) given that \(f (x) =162\).
A potato is placed in an oven heated to a temperature of 200°C.
The temperature of the potato, in °C, is modelled by the function \(p(t) = 200 - 190{(0.97)^t}\), where \(t\) is the time, in minutes, that the potato has been in the oven.
Write down the temperature of the potato at the moment it is placed in the oven.
Find the temperature of the potato half an hour after it has been placed in the oven.
After the potato has been in the oven for \(k\) minutes, its temperature is 40°C.
Find the value of \(k\).
Sejah placed a baking tin, that contained cake mix, in a preheated oven in order to bake a cake. The temperature in the centre of the cake mix, \(T\), in degrees Celsius (°C) is given by
\[T(t) = 150 - a \times {(1.1)^{ - t}}\]
where \(t\) is the time, in minutes, since the baking tin was placed in the oven. The graph of \(T\) is shown in the following diagram.
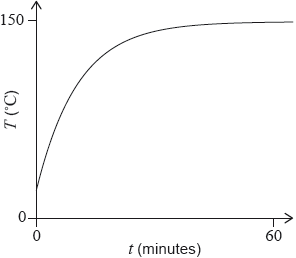
The temperature in the centre of the cake mix was 18 °C when placed in the oven.
The baking tin is removed from the oven 15 minutes after the temperature in the centre of the cake mix has reached 130 °C.
Write down what the value of 150 represents in the context of the question.
Find the value of \(a\).
Find the total time that the baking tin is in the oven.
Consider the function \(f\left( x \right) = \frac{{{x^4}}}{4}\).
Find f'(x)
Find the gradient of the graph of f at \(x = - \frac{1}{2}\).
Find the x-coordinate of the point at which the normal to the graph of f has gradient \({ - \frac{1}{8}}\).
Shiyun bought a car in 1999. The value of the car \(V\) , in USD, is depreciating according to the exponential model
\[V = 25000 \times {1.5^{ - 0.2t}}{\text{, }}t \geqslant 0\]
where \(t\) is the time, in years, that Shiyun has owned the car.
Write down the value of the car when Shiyun bought it.
Calculate the value of the car three years after Shiyun bought it. Give your answer correct to two decimal places.
Calculate the time for the car to depreciate to half of its value since Shiyun bought it.
Consider the quadratic function, \(f(x) = px(q - x)\), where \(p\) and \(q\) are positive integers.
The graph of \(y = f(x)\) passes through the point \((6,{\text{ }}0)\).
Calculate the value of \(q\).
The vertex of the function is \((3,{\text{ }}27)\).
Find the value of \(p\).
The vertex of the function is \((3,{\text{ }}27)\).
Write down the range of \(f\).
A sketch of the function \(f(x) = 5{x^3} - 3{x^5} + 1\) is shown for \( - 1.5 \leqslant x \leqslant 1.5\) and \( - 6 \leqslant y \leqslant 6\) .

Write down \(f'(x)\) .
Find the equation of the tangent to the graph of \(y = f(x)\) at \((1{\text{, }}3)\) .
Write down the coordinates of the second point where this tangent intersects the graph of \(y = f(x)\) .
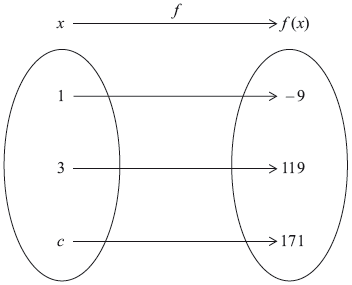
A function f (x) = p×2x + q is defined by the mapping diagram below.

Find the value of
(i) p ;
(ii) q .
Write down the value of r .
Find the value of s .
The number of fish, \(N\), in a pond is decreasing according to the model
\[N(t) = a{b^{ - t}} + 40,\;\;\;t \geqslant 0\]
where \(a\) and \(b\) are positive constants, and \(t\) is the time in months since the number of fish in the pond was first counted.
At the beginning \(840\) fish were counted.
Find the value of \(a\).
After \(4\) months \(90\) fish were counted.
Find the value of \(b\).
The number of fish in the pond will not decrease below \(p\).
Write down the value of \(p\).
The size of a computer screen is the length of its diagonal. Zuzana buys a rectangular computer screen with a size of 68 cm, a height of \(y\) cm and a width of \(x\) cm, as shown in the diagram.
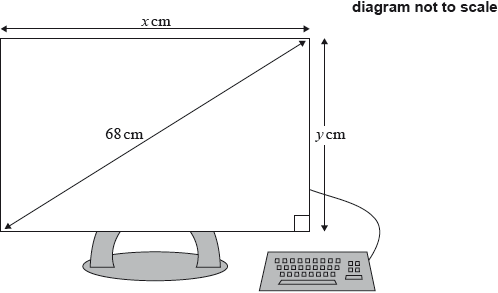
The ratio between the height and the width of the screen is 3:4.
Use this information to write down an equation involving \(x\) and \(y\).
Use this ratio to write down \(y\) in terms of \(x\).
Find the value of \(x\) and of \(y\).
Gabriella purchases a new car.
The car’s value in dollars, \(V\), is modelled by the function
\[V(t) = 12870 - k{(1.1)^t},{\text{ }}t \geqslant 0\]
where \(t\) is the number of years since the car was purchased and \(k\) is a constant.
After two years, the car’s value is $9143.20.
This model is defined for \(0 \leqslant t \leqslant n\). At \(n\) years the car’s value will be zero dollars.
Write down, and simplify, an expression for the car’s value when Gabriella purchased it.
Find the value of \(k\).
Find the value of \(n\).
Factorise the expression \({x^2} - 3x - 10\).
A function is defined as \(f(x) = 1 + {x^3}\) for \(x \in \mathbb{Z}{\text{, }} {- 3} \leqslant x \leqslant 3\).
(i) List the elements of the domain of \(f(x)\).
(ii) Write down the range of \(f(x)\).
Consider the quadratic function \(f\left( x \right) = a{x^2} + bx + 22\).
The equation of the line of symmetry of the graph \(y = f\left( x \right){\text{ is }}x = 1.75\).
The graph intersects the x-axis at the point (−2 , 0).
Using only this information, write down an equation in terms of a and b.
Using this information, write down a second equation in terms of a and b.
Hence find the value of a and of b.
The graph intersects the x-axis at a second point, P.
Find the x-coordinate of P.
The golden ratio, \(r\) , was considered by the Ancient Greeks to be the perfect ratio between the lengths of two adjacent sides of a rectangle. The exact value of \(r\) is \(\frac{{1 + \sqrt 5 }}{2}\).
Write down the value of \(r\)
i) correct to \(5\) significant figures;
ii) correct to \(2\) decimal places.
Phidias is designing rectangular windows with adjacent sides of length \(x\) metres and \(y\) metres. The area of each window is \(1\,{{\text{m}}^2}\).
Write down an equation to describe this information.
Phidias designs the windows so that the ratio between the longer side, \(y\) , and the shorter side, \(x\) , is the golden ratio, \(r\).
Write down an equation in \(y\) , \(x\) and \(r\) to describe this information.
Find the value of \(x\) .
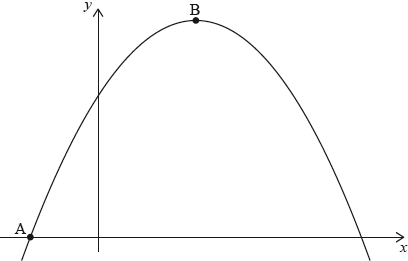
The graph of the quadratic function \(f (x) = c + bx − x^2\) intersects the y-axis at point A(0, 5) and has its vertex at point B(2, 9).

Write down the value of c.
Find the value of b.
Find the x-intercepts of the graph of f .
Write down \(f (x)\) in the form \(f (x) = −(x − p) (x + q)\).
A building company has many rectangular construction sites, of varying widths, along a road.
The area, \(A\), of each site is given by the function
\[A(x) = x(200 - x)\]
where \(x\) is the width of the site in metres and \(20 \leqslant x \leqslant 180\).
Site S has a width of \(20\) m. Write down the area of S.
Site T has the same area as site S, but a different width. Find the width of T.
When the width of the construction site is \(b\) metres, the site has a maximum area.
(i) Write down the value of \(b\).
(ii) Write down the maximum area.
The range of \(A(x)\) is \(m \leqslant A(x) \leqslant n\).
Hence write down the value of \(m\) and of \(n\).
A quadratic function, \(f(x) = a{x^2} + bx\), is represented by the mapping diagram below.

Use the mapping diagram to write down two equations in terms of a and b.
Find the value of a.
Find the value of b.
Calculate the x-coordinate of the vertex of the graph of f (x).
An iron bar is heated. Its length, \(L\), in millimetres can be modelled by a linear function, \(L = mT + c\), where \(T\) is the temperature measured in degrees Celsius (°C).
At 150°C the length of the iron bar is 180 mm.
Write down an equation that shows this information.
At 210°C the length of the iron bar is 181.5 mm.
Write down an equation that shows this second piece of information.
At 210°C the length of the iron bar is 181.5 mm.
Hence, find the length of the iron bar at 40°C.
Consider the quadratic function y = f (x) , where f (x) = 5 − x + ax2.
It is given that f (2) = −5 . Find the value of a .
Find the equation of the axis of symmetry of the graph of y = f (x) .
Write down the range of this quadratic function.
The following is the graph of the quadratic function y = f (x).

Write down the solutions to the equation f (x) = 0.
Write down the equation of the axis of symmetry of the graph of f (x).
The equation f (x) = 12 has two solutions. One of these solutions is x = 6. Use the symmetry of the graph to find the other solution.
The minimum value for y is – 4. Write down the range of f (x).
A quadratic curve with equation y = ax (x − b) is shown in the following diagram.

The x-intercepts are at (0, 0) and (6, 0), and the vertex V is at (h, 8).
Find the value of h.
Find the equation of the curve.
Factorise the expression \({x^2} - kx\) .
Hence solve the equation \({x^2} - kx = 0\) .
The diagram below shows the graph of the function \(f(x) = {x^2} - kx\) for a particular value of \(k\).

Write down the value of \(k\) for this function.
The diagram below shows the graph of the function \(f(x) = {x^2} - kx\) for a particular value of \(k\).
Find the minimum value of the function \(y = f(x)\) .
Consider the graph of the function \(y = f(x)\) defined below.

Write down all the labelled points on the curve
that are local maximum points;
where the function attains its least value;
where the function attains its greatest value;
where the gradient of the tangent to the curve is positive;
where \(f(x) > 0\) and \(f'(x) < 0\) .
Consider the function \(f(x) = a{x^2} + c\).
Find \(f'(x)\)
Point \({\text{A}}( - 2,\,5)\) lies on the graph of \(y = f(x)\) . The gradient of the tangent to this graph at \({\text{A}}\) is \( - 6\) .
Find the value of \(a\) .
Find the value of \(c\) .
The diagram shows part of the graph of a function \(y = f(x)\). The graph passes through point \({\text{A}}(1,{\text{ }}3)\).
The tangent to the graph of \(y = f(x)\) at A has equation \(y = - 2x + 5\). Let \(N\) be the normal to the graph of \(y = f(x)\) at A.
Write down the value of \(f(1)\).
Find the equation of \(N\). Give your answer in the form \(ax + by + d = 0\) where \(a\), \(b\), \(d \in \mathbb{Z}\).
Draw the line \(N\) on the diagram above.
Water has a lower boiling point at higher altitudes. The relationship between the boiling point of water (T) and the height above sea level (h) can be described by the model \(T = -0.0034h +100\) where T is measured in degrees Celsius (°C) and h is measured in metres from sea level.
Write down the boiling point of water at sea level.
Use the model to calculate the boiling point of water at a height of 1.37 km above sea level.
Water boils at the top of Mt. Everest at 70 °C.
Use the model to calculate the height above sea level of Mt. Everest.
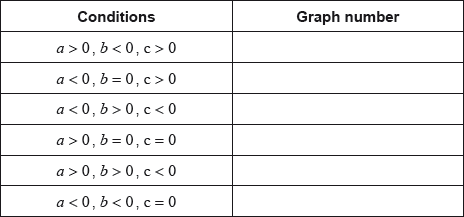
Consider the following graphs of quadratic functions.
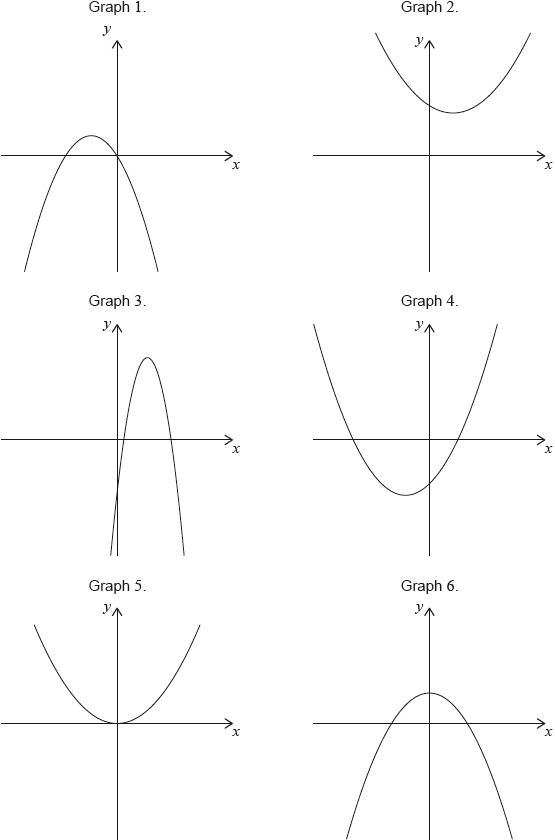
The equation of each of the quadratic functions can be written in the form \(y = a{x^2} + bx + c\), where \(a \ne 0\).
Each of the sets of conditions for the constants \(a\), \(b\) and \(c\), in the table below, corresponds to one of the graphs above.
Write down the number of the corresponding graph next to each set of conditions.
The following function models the growth of a bacteria population in an experiment,
P(t) = A × 2t, t ≥ 0
where A is a constant and t is the time, in hours, since the experiment began.
Four hours after the experiment began, the bacteria population is 6400.
Find the value of A.
Interpret what A represents in this context.
Find the time since the experiment began for the bacteria population to be equal to 40A.
Consider the function \(f(x) = p{(0.5)^x} + q\) where p and q are constants. The graph of f (x) passes through the points \((0,\,6)\) and \((1,\,4)\) and is shown below.

Write down two equations relating p and q.
Find the value of p and of q.
Write down the equation of the horizontal asymptote to the graph of f (x).
A population of mosquitoes decreases exponentially. The size of the population, \(P\) , after \(t\) days is modelled by
\(P = 3200 \times {2^{ - t}} + 50\) , where \(t \geqslant 0\) .
Write down the exact size of the initial population.
Find the size of the population after \(4\) days.
Calculate the time it will take for the size of the population to decrease to \(60\).
The population will stabilize when it reaches a size of \(k\) .
Write down the value of \(k\) .
The function \(g(x)\) is defined as \(g(x) = 16 + k({c^{ - x}})\) where \(c > 0\) .
The graph of the function \(g\) is drawn below on the domain \(x \geqslant 0\) .

The graph of \(g\) intersects the y-axis at (0, 80) .
Find the value of \(k\) .
The graph passes through the point (2, 48) .
Find the value of \(c\) .
The graph passes through the point (2, 48) .
Write down the equation of the horizontal asymptote to the graph of \(y = g(x)\) .
Consider the function \(f(x) = 1.25 - {a^{ - x}}\) , where a is a positive constant and \(x \geqslant 0\). The diagram shows a sketch of the graph of \(f\) . The graph intersects the \(y\)-axis at point A and the line \(L\) is its horizontal asymptote.

Find the \(y\)-coordinate of A .
The point \((2{\text{, }}1)\) lies on the graph of \(y = f(x)\) . Calculate the value of \(a\) .
The point \((2{\text{, }}1)\) lies on the graph of \(y = f(x)\) . Write down the equation of \(L\) .
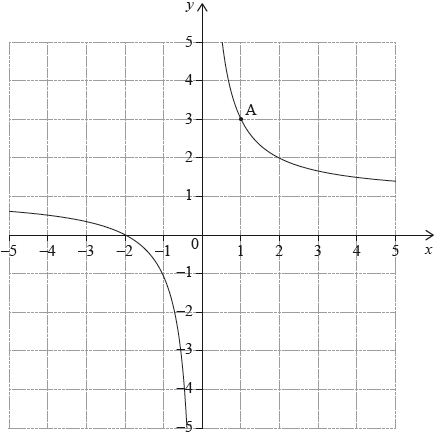
Consider the graph of the function \(f\left( x \right) = \frac{3}{x} - 2,\,\,\,x \ne 0\).
Write down the equation of the vertical asymptote.
Write down the equation of the horizontal asymptote.
Calculate the value of x for which f(x) = 0 .
A population of \(200\) rabbits was introduced to an island. One week later the number of rabbits was \(210\). The number of rabbits, \(N\) , can be modelled by the function
\[N(t) = 200 \times {b^t},\,\,t \geqslant 0\,,\]
where \(t\) is the time, in weeks, since the rabbits were introduced to the island.
Find the value of \(b\) .
Calculate the number of rabbits on the island after 10 weeks.
An ecologist estimates that the island has enough food to support a maximum population of 1000 rabbits.
Calculate the number of weeks it takes for the rabbit population to reach this maximum.
A rumour spreads through a group of teenagers according to the exponential model
\(N = 2 \times {(1.81)^{0.7t}}\)
where N is the number of teenagers who have heard the rumour t hours after it is first started.
Find the number of teenagers who started the rumour.
Write down the number of teenagers who have heard the rumour five hours after it is first started.
Determine the length of time it would take for 150 teenagers to have heard the rumour. Give your answer correct to the nearest minute.
Jashanti is saving money to buy a car. The price of the car, in US Dollars (USD), can be modelled by the equation
\[P = 8500{\text{ }}{(0.95)^t}.\]
Jashanti’s savings, in USD, can be modelled by the equation
\[S = 400t + 2000.\]
In both equations \(t\) is the time in months since Jashanti started saving for the car.
Jashanti does not want to wait too long and wants to buy the car two months after she started saving. She decides to ask her parents for the extra money that she needs.
Write down the amount of money Jashanti saves per month.
Use your graphic display calculator to find how long it will take for Jashanti to have saved enough money to buy the car.
Calculate how much extra money Jashanti needs.
The \(x\)-coordinate of the minimum point of the quadratic function \(f(x) = 2{x^2} + kx + 4\) is \(x =1.25\).
(i) Find the value of \(k\) .
(ii) Calculate the \(y\)-coordinate of this minimum point.
Sketch the graph of \(y = f(x)\) for the domain \( - 1 \leqslant x \leqslant 3\).

The diagram shows part of the graph of \(y = 2^{-x} + 3 \), and its horizontal asymptote. The graph passes through the points (0, a) and (b, 3.5).

Find the value of
(i) a ;
(ii) b .
Write down the equation of the horizontal asymptote to this graph.
In an experiment it is found that a culture of bacteria triples in number every four hours. There are \(200\) bacteria at the start of the experiment.

Find the value of \(a\).
Calculate how many bacteria there will be after one day.
Find how long it will take for there to be two million bacteria.
The diagram below shows the graph of a quadratic function. The graph passes through the points (6, 0) and (p, 0). The maximum point has coordinates (0.5, 30.25).

Calculate the value of p.
Given that the quadratic function has an equation \(y = -x^2 + bx + c\) where \(b,{\text{ }}c \in \mathbb{Z}\), find \(b\) and \(c\).
The number of cells, C, in a culture is given by the equation \(C = p \times 2^{0.5t} + q\), where t is the time in hours measured from 12:00 on Monday and p and q are constants.
The number of cells in the culture at 12:00 on Monday is 47.
The number of cells in the culture at 16:00 on Monday is 53.
Use the above information to write down two equations in p and q ;
Use the above information to calculate the value of p and of q ;
Use the above information to find the number of cells in the culture at 22:00 on Monday.
The graph of a quadratic function has \(y\)-intercept 10 and one of its \(x\)-intercepts is 1.
The \(x\)-coordinate of the vertex of the graph is 3.
The equation of the quadratic function is in the form \(y = a{x^2} + bx + c\).
Write down the value of \(c\).
Find the value of \(a\) and of \(b\).
Write down the second \(x\)-intercept of the function.
The amount of electrical charge, C, stored in a mobile phone battery is modelled by \(C(t) = 2.5 - {2^{ - t}}\), where t, in hours, is the time for which the battery is being charged.
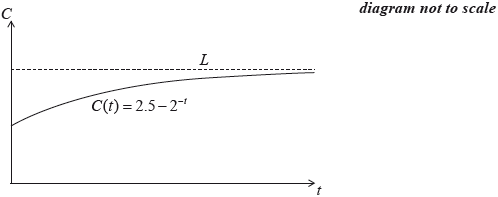
Write down the amount of electrical charge in the battery at \(t = 0\).
The line \(L\) is the horizontal asymptote to the graph.
Write down the equation of \(L\).
To download a game to the mobile phone, an electrical charge of 2.4 units is needed.
Find the time taken to reach this charge. Give your answer correct to the nearest minute.
The function \(f\) is of the form \(f(x) = ax + b + \frac{c}{x}\), where \(a\) , \(b\) and \(c\) are positive integers.
Part of the graph of \(y = f(x)\) is shown on the axes below. The graph of the function has its local maximum at \(( - 2,{\text{ }} - 2)\) and its local minimum at \((2,{\text{ }}6)\).
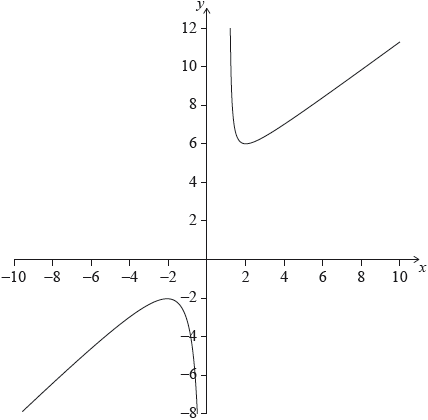
Write down the domain of the function.
Draw the line \(y = - 6\) on the axes.
Write down the number of solutions to \(f(x) = - 6\).
Find the range of values of \(k\) for which \(f(x) = k\) has no solution.
A computer virus spreads according to the exponential model
\[N = 200 \times {(1.9)^{0.85t}},{\text{ }}t \geqslant 0\]
where \(N\) is the number of computers infected, and \(t\) is the time, in hours, after the initial infection.
Calculate the number of computers infected after \(6\) hours.
Calculate the time for the number of infected computers to be greater than \({\text{1}}\,{\text{000}}\,{\text{000}}\).
Give your answer correct to the nearest hour.
Passengers of Flyaway Airlines can purchase tickets for either Business Class or Economy Class.
On one particular flight there were 154 passengers.
Let \(x\) be the number of Business Class passengers and \(y\) be the number of Economy Class passengers on this flight.
On this flight, the cost of a ticket for each Business Class passenger was 320 euros and the cost of a ticket for each Economy Class passenger was 85 euros. The total amount that Flyaway Airlines received for these tickets was \({\text{14}}\,{\text{970 euros}}\).
The airline’s finance officer wrote down the total amount received by the airline for these tickets as \({\text{14}}\,{\text{270 euros}}\).
Use the above information to write down an equation in \(x\) and \(y\).
Use the information about the cost of tickets to write down a second equation in \(x\) and \(y\).
Find the value of \(x\) and the value of \(y\).
Find the percentage error.
The graph of y = 2x2 \( - \) rx + q is shown for \( - 5 \leqslant x \leqslant 7\).

The graph cuts the y axis at (0, 4).
Write down the value of q.
The axis of symmetry is x = 2.5.
Find the value of r.
The axis of symmetry is x = 2.5.
Write down the minimum value of y.
The axis of symmetry is x = 2.5.x
Write down the range of y.
A function \(f\) is given by \(f(x) = 4{x^3} + \frac{3}{{{x^2}}} - 3,{\text{ }}x \ne 0\).
Write down the derivative of \(f\).
Find the point on the graph of \(f\) at which the gradient of the tangent is equal to 6.
A store sells bread and milk. On Tuesday, 8 loaves of bread and 5 litres of milk were sold for $21.40. On Thursday, 6 loaves of bread and 9 litres of milk were sold for $23.40.
If \(b =\) the price of a loaf of bread and \(m =\) the price of one litre of milk, Tuesday’s sales can be written as \(8b + 5m = 21.40\).
Using simplest terms, write an equation in b and m for Thursday’s sales.
Find b and m.
Draw a sketch, in the space provided, to show how the prices can be found graphically.

A hotel has a rectangular swimming pool. Its length is \(x\) metres, its width is \(y\) metres and its perimeter is \(44\) metres.
Write down an equation for \(x\) and \(y\).
The area of the swimming pool is \({\text{112}}{{\text{m}}^2}\).
Write down a second equation for \(x\) and \(y\).
Use your graphic display calculator to find the value of \(x\) and the value of \(y\).
An Olympic sized swimming pool is \(50\) m long and \(25\) m wide.
Determine the area of the hotel swimming pool as a percentage of the area of an Olympic sized swimming pool.
Part of the graph of the quadratic function f is given in the diagram below.

On this graph one of the x-intercepts is the point (5, 0). The x-coordinate of the maximum point is 3.
The function f is given by \( f (x) = -x^2 + bx + c \), where \(b,c \in \mathbb{Z}\)
Find the value of
(i) b ;
(ii) c .
The domain of f is 0 ≤ x ≤ 6.
Find the range of f .
In an experiment, a number of fruit flies are placed in a container. The population of fruit flies, P , increases and can be modelled by the function
\[P\left( t \right) = 12 \times {3^{0.498t}},\,\,t \geqslant 0,\]
where t is the number of days since the fruit flies were placed in the container.
Find the number of fruit flies which were placed in the container.
Find the number of fruit flies that are in the container after 6 days.
The maximum capacity of the container is 8000 fruit flies.
Find the number of days until the container reaches its maximum capacity.
On the grid below sketch the graph of the function \(f(x) = 2{(1.6)^x}\) for the domain \(0 \leqslant x \leqslant 3\) .

Write down the coordinates of the \(y\)-intercept of the graph of \(y = f(x)\) .
On the grid draw the graph of the function \(g(x) = 5 - 2x\) for the domain \(0 \leqslant x \leqslant 3\).
Use your graphic display calculator to solve \(f(x) = g(x)\) .
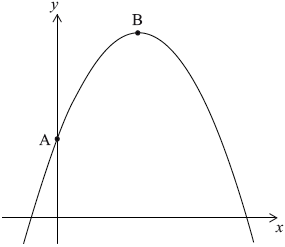
The graph of the quadratic function \(f(x) = c + bx - {x^2}\) intersects the \(x\)-axis at the point \({\text{A}}( - 1,{\text{ }}0)\) and has its vertex at the point \({\text{B}}(3,{\text{ }}16)\).
Write down the equation of the axis of symmetry for this graph.
Find the value of \(b\).
Write down the range of \(f(x)\).
The graph of the quadratic function \(f(x) = a{x^2} + bx + c\) intersects the y-axis at point A (0, 5) and has its vertex at point B (4, 13).
Write down the value of \(c\).
By using the coordinates of the vertex, B, or otherwise, write down two equations in \(a\) and \(b\).
Find the value of \(a\) and of \(b\).
Consider the functions \(f(x) = x + 1\) and \(g(x) = {3^x} - 2\).
Write down
(i) the \(x\)-intercept of the graph of \(y = {\text{ }}f(x)\);
(ii) the \(y\)-intercept of the graph of \(y = {\text{ }}g(x)\).
Solve \(f(x) = g(x)\).
Write down the interval for the values of \(x\) for which \(f(x) > g(x)\).
A quadratic function \(f:x \mapsto a{x^2} + b\), where \(a\) and \(b \in \mathbb{R}\) and \(x \geqslant 0\), is represented by the mapping diagram.
Using the mapping diagram, write down two equations in terms of \(a\) and \(b\).
Solve the equations to find the value of
(i) \(a\);
(ii) \(b\).
Find the value of \(c\).
Consider the straight lines L1 and L2 . R is the point of intersection of these lines.

The equation of line L1 is y = ax + 5.
The equation of line L2 is y = −2x + 3.
Find the value of a.
Find the coordinates of R.
Line L3 is parallel to line L2 and passes through the point (2, 3).
Find the equation of line L3. Give your answer in the form y = mx + c.
The graph of a quadratic function \(y = f (x)\) is given below.

Write down the equation of the axis of symmetry.
Write down the coordinates of the minimum point.
Write down the range of \(f (x)\).
A small manufacturing company makes and sells \(x\) machines each month. The monthly cost \(C\) , in dollars, of making \(x\) machines is given by
\[C(x) = 2600 + 0.4{x^2}{\text{.}}\]The monthly income \(I\) , in dollars, obtained by selling \(x\) machines is given by
\[I(x) = 150x - 0.6{x^2}{\text{.}}\]\(P(x)\) is the monthly profit obtained by selling \(x\) machines.
Find \(P(x)\) .
Find the number of machines that should be made and sold each month to maximize \(P(x)\) .
Use your answer to part (b) to find the selling price of each machine in order to maximize \(P(x)\) .
Consider the function \(f(x) = {x^3} - 3{x^2} + 2x + 2\) . Part of the graph of \(f\) is shown below.

Find \(f'(x)\) .
There are two points at which the gradient of the graph of \(f\) is \(11\). Find the \(x\)-coordinates of these points.
Consider the functions \(f\left( x \right) = {x^4} - 2\) and \(g\left( x \right) = {x^3} - 4{x^2} + 2x + 6\)
The functions intersect at points P and Q. Part of the graph of \(y = f\left( x \right)\) and part of the graph of \(y = g\left( x \right)\) are shown on the diagram.

Find the range of f.
Write down the x-coordinate of P and the x-coordinate of Q.
Write down the values of x for which \(f\left( x \right) > g\left( x \right)\).
A factory produces shirts. The cost, C, in Fijian dollars (FJD), of producing x shirts can be modelled by
C(x) = (x − 75)2 + 100.
The cost of production should not exceed 500 FJD. To do this the factory needs to produce at least 55 shirts and at most s shirts.
Find the cost of producing 70 shirts.
Find the value of s.
Find the number of shirts produced when the cost of production is lowest.
The graph of the quadratic function \(f(x) = 3 + 4x - {x^2}\) intersects the \(y\)-axis at point A and has its vertex at point B .

Find the coordinates of B .
Another point, C , which lies on the graph of \(y = f(x)\) has the same \(y\)-coordinate as A .
(i) Plot and label C on the graph above.
(ii) Find the \(x\)-coordinate of C .
Consider the numbers \(2\), \(\sqrt 3 \), \( - \frac{2}{3}\) and the sets \(\mathbb{N}\), \(\mathbb{Z}\), \(\mathbb{Q}\) and \(\mathbb{R}\).
Complete the table below by placing a tick in the appropriate box if the number is an element of the set, and a cross if it is not.
A function \(f\) is given by \(f(x) = 2{x^2} - 3x{\text{, }}x \in \{ - 2{\text{, }}2{\text{, }}3\} \).
Write down the range of function \(f\).
The following curves are sketches of the graphs of the functions given below, but in a different order. Using your graphic display calculator, match the equations to the curves, writing your answers in the table below.
(the diagrams are not to scale)


y = f (x) is a quadratic function. The graph of f (x) intersects the y-axis at the point A(0, 6) and the x-axis at the point B(1, 0). The vertex of the graph is at the point C(2, –2).
Write down the equation of the axis of symmetry.
Sketch the graph of y = f (x) on the axes below for 0 ≤ x ≤ 4 . Mark clearly on the sketch the points A , B , and C.

The graph of y = f (x) intersects the x-axis for a second time at point D.
Write down the x-coordinate of point D.
The function \(f(x) = 5 - 3({2^{ - x}})\) is defined for \(x \geqslant 0\).
On the axes below sketch the graph of f (x) and show the behaviour of the curve as x increases.
Write down the coordinates of any intercepts with the axes.
Draw the line y = 5 on your sketch.
Write down the number of solutions to the equation f (x) = 5 .
Consider the curve \(y = 1 + \frac{1}{{2x}},\,\,x \ne 0.\)
For this curve, write down
i) the value of the \(x\)-intercept;
ii) the equation of the vertical asymptote.
Sketch the curve for \( - 2 \leqslant x \leqslant 4\) on the axes below.

The axis of symmetry of the graph of a quadratic function has the equation x \( = - \frac{1}{2}\)
.
Draw the axis of symmetry on the following axes.
The graph of the quadratic function intersects the x-axis at the point N(2, 0) . There is a second point, M, at which the graph of the quadratic function intersects the x-axis.
Draw the axis of symmetry on the following axes.
The graph of the quadratic function intersects the \(x\)-axis at the point \({\text{N}}(2, 0)\). There is a second point, \({\text{M}}\), at which the graph of the quadratic function intersects the \(x\)-axis.
Clearly mark and label point \({\text{M}}\) on the axes.
(i) Find the value of \(b\) and the value of \(c\).
(ii) Draw the graph of the function on the axes.